In an experiment, the resistance of a material is plotted as a function of temperature (in some range). As shown in the figure, it is a straight line. One may conclude that :

Show Hint
- \(R(T)=R_0e^{-T^2/T_0^2}\)
- \(R(T)=\dfrac{R_0}{T^2}\)
- \(R(T)=R_0e^{T^2/T_0^2}\)
- \(R(T)=R_0e^{-T_0^2/T^2}\)

The Correct Option is D
Solution and Explanation
\(\ln R = \ln R_0 - T_0^2\left(\dfrac{1}{T^2}\right)\) (intercept \(\ln R_0\), slope \(-T_0^2\)).
Taking the exponential: \(R(T)=R_0\,e^{-T_0^2/T^2}\).
Answer: (4) \(R(T)=R_0e^{-T_0^2/T^2}\)
Top JEE Main Physics Questions
- Two masses $m$ and $\frac{m}{2}$ are connected at the two ends of a massless rigid rod of length $l$. The rod is suspended by a thin wire of torsional constant $k$ at the centre of mass of the rod-mass system(see figure). Because of torsional constant $k$, the restoring torque is $\tau =k\theta$ for angular displacement $\theta$. If the rod is rota ted by $\theta_0$ and released, the tension in it when it passes through its mean position will be:
A black body is at a temperature of 2880 K. The energy of radiation emitted by this body with wavelength between 499 nm and 500 nm is U1, between 999 nm and 1000 nm is U2 and between 1499 nm and 1500 nm is U3. The Wien's constant, b = 2.88×10⁶ nm-K. Then,
- $I _{ CM }$ is the moment of inertia of a circular disc about an axis (CM) passing through its center and perpendicular to the plane of disc $I_{A B}$ is it's moment of inertia about an axis $AB$ perpendicular to plane and parallel to axis $CM$ at a distance $\frac{2}{3} R$ from center Where $R$ is the radius of the dise The ratio of $I _{ AB }$ and $I _{ CM }$ is $x: 9$ The value of $x$ is______

- A nucleus disintegrates into two smaller parts, which have their velocities in the ratio $3: 2$ The ratio of their nuclear sizes will be $\left(\frac{x}{3}\right)^{\frac{1}{3}}$ The value of ' $x$ ' is:-
- A particle starts with an initial velocity of 10.0 m/s along x-direction and accelerates uniformly at the rate of 2.0 m/s$^2$. The time taken by the particle to reach the velocity of 60.0 m/s is
Top JEE Main Current electricity Questions
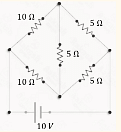
- In the given circuit, find electric current drawn from battery :
- If the current through an incandescent lamp decreases by 20%, how much change will be there in its illumination?
- A potential divider circuit is shown in figure. The output voltage V0 is

- Two cells are connected in opposition as shown. Cell \( E_1 \) is of 8 V emf and 2 \( \Omega \) internal resistance; the cell \( E_2 \) is of 2 V emf and 4 \( \Omega \) internal resistance. The terminal potential difference of cell \( E_2 \) is:

- Wheatstone bridge principle is used to measure the specific resistance \( (S_1) \) of a given wire, having length \( L \), radius \( r \). If \( X \) is the resistance of the wire, then specific resistance is: $$ S_1 = X\left( \frac{\pi r^2}{L} \right). $$ If the length of the wire gets doubled, then the value of specific resistance will be:
Top JEE Main Questions
- Two masses $m$ and $\frac{m}{2}$ are connected at the two ends of a massless rigid rod of length $l$. The rod is suspended by a thin wire of torsional constant $k$ at the centre of mass of the rod-mass system(see figure). Because of torsional constant $k$, the restoring torque is $\tau =k\theta$ for angular displacement $\theta$. If the rod is rota ted by $\theta_0$ and released, the tension in it when it passes through its mean position will be:
What will be the equilibrium constant of the given reaction carried out in a \(5 \,L\) vessel and having equilibrium amounts of \(A_2\) and \(A\) as \(0.5\) mole and \(2 \times 10^{-6}\) mole respectively?
The reaction : \(A_2 \rightleftharpoons 2A\)- The value of is
- The number of terms of an is even. The sum of the odd terms is and of the even terms is . The last term exceeds the first by . Then the number of terms in the series is ______.
A black body is at a temperature of 2880 K. The energy of radiation emitted by this body with wavelength between 499 nm and 500 nm is U1, between 999 nm and 1000 nm is U2 and between 1499 nm and 1500 nm is U3. The Wien's constant, b = 2.88×10⁶ nm-K. Then,