60 employees in an office were asked about their preference for tea and coffee. It was observed that for every 3 people who prefer tea, there are 2 who prefer coffee. For every 6 people who prefer tea, there are 2 who drink both of tea and coffee. The number of people who drink both is the same as those who drink neither.
How many people drink both tea and coffee?
How many people drink both tea and coffee?
- 10
- 12
- 14
- 16
The Correct Option is B
Solution and Explanation
To solve this problem, let's use a systematic approach using algebra. Let \( T \) be the number of people who prefer tea, \( C \) be the number of people who prefer coffee, and \( B \) be the number of people who drink both tea and coffee. Also, let \( N \) be those who drink neither.
1. According to the problem, for every 3 who prefer tea, 2 prefer coffee. This gives us the ratio:
\[\frac{T}{C} = \frac{3}{2}\]
Therefore, \( T = \frac{3}{2}C \) or \( C = \frac{2}{3}T \).
2. It also states that for every 6 people who prefer tea, 2 drink both tea and coffee. Therefore:
\[\frac{T}{B} = \frac{6}{2} = 3\]
This implies \( T = 3B \).
3. The number of people who drink both is the same as those who drink neither, so \( B = N \).
4. The total number of people is the sum of people who prefer only tea, only coffee, both, and neither:
\[T + C - B + N = 60\]
Substituting \( B = N \) into the equation:
\[T + C = 60\]
5. Substitute the expressions from steps 1 and 2 into this equation:
\[3B + \frac{2}{3}(3B) = 60\]
\[3B + 2B = 60\]
\[5B = 60\]
\[B = 12\]
We conclude that \( \boxed{12} \) people drink both tea and coffee.
Top SNAP Logical Reasoning Questions
- Four children A, B, C and D are having some chocolates each.
A gives B as many as he already has, he gives C twice of what C already has and he gives D thrice of what D already has.
Now, D gives (\(\frac 18\))th of his own chocolates to B.
Then A gives 10% chocolates he now owns to C and 20% to B.
Finally, all of them have 35 chocolates each. What is the original number of chocolates each had in the beginning? - There are two similar figures below with some numbers. The left one is complete where as one number is missing in the right one. Find a suitable number to fill in place of the question mark.

- Complete the following series by replacing the ?
TBLD, VEPI, XHTN, ? - In a cricket team, three batsmen Ricky, Sachin and Brian are the top three run-scorers in any order. Each of them gives two replies to any question, one of which is true and the other is false, again, in any order. When asked about who the top scorer was, following were the replies they gave:
Sachin : I got the top score. Ricky was second.
Brian : I got the top score. Sachin was second.
Ricky : I got the top score. Sachin was third.
Which of the following is the correct order of batsmen who got the top score, second best and third best score respectively? - A clock strikes once at 1 o'clock, twice at 2 o'clock and so on. If it takes 6 seconds to strike at 3 o'clock, how much time will it take to strike at 9 o'clock?
Top SNAP Venn Diagrams Questions
- A placement company has to assign 1000 SW personnel who are skilled in Java and Dot Net to a prospective outsourcing company. He finds that 750 are having Dot Net skills and 450 have Java skills. Some have skills in both Java and Dot Net. Find the numbers who have skills in both Java and Dot Net.
- No national productivity measures are available for underground industries that may exist but remain unreported. On the other hand, at least some industries that are run entirely by self - employed industrialists are included in national productivity measures. From the information given above, it can be validly concluded that
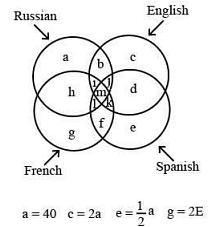
- Staff employed in a UNESCO office in Paris are represented by four intersecting circles as in the given diagram. Each circle represents people who can read and write English, French, Spanish and Russian. Strength of people in each circle is also shown alongside. Study the diagram to answer the questions that follow.
- Consider the following information :
Set A: Animals that can fly
Set B: Birds
Set C: Animals that live in water
Using Venn diagrams, represent the relationships between these sets and answer the question.
Which region(s) in the Venn diagram represents animals that can fly and also live in water ? - In a school students at Pioneer career Kolkata wrote Mock test which has three subjects DI, VA and QA, here is the result of these students. 80 students cleared cut off in DI, 70 in VA and 60 in QA. Only 40 students cleared all the three subjects. 10 students failed to clear cut off even in one subjects. 50 students cleared cut off in VA and QA. 5 students cleared in cut off in only QA.
Top SNAP Questions
- In a retail outlet, the average revenue was Rs.10,000 per day over a 30 day period. During this period, the average revenue on weekends (total 8 days) was Rs. 20,000 per day. What was the average daily revenue on weekdays?
- Two different prime numbers X and Y, both are greater than 2, then which of the following must be true?
- It takes 6 hours for pump A, used alone, to fill a tank of water. Pump B alone takes 8 hours to fill the same tank. A, B and another pump C all together fill the tank in 2 hours. How long would pump C take, used alone, to fill the tank?
- A swimming pool can be filled by pipe A in 3 hours and by pipe B in 6 hours, each pump working on its own. At 9 am, pump A is started. At what time will the swimming pool be filled if pump B is started at 10 am?
- The sum of prime numbers that are greater than 60, but less than 70 is :