Question:
Which one of the following entropy (S) - temperature (T) diagrams CORRECTLY represents the Carnot cycle abcda shown in the P-V diagram?

Which one of the following entropy (S) - temperature (T) diagrams CORRECTLY represents the Carnot cycle abcda shown in the P-V diagram?
Show Hint
For a Carnot cycle, isothermal processes are straight horizontal lines in the entropy-temperature diagram, while adiabatic processes are curved.
Updated On: Aug 30, 2025
Show Solution
Verified By Collegedunia
The Correct Option is D
Solution and Explanation
- In the Carnot cycle, the entropy (S) - temperature (T) diagram involves two isothermal processes and two adiabatic processes.
- The isothermal processes occur at constant temperature (i.e., straight lines in the S-T diagram).
- The adiabatic processes, on the other hand, involve changes in both temperature and entropy. These are typically represented as curved lines in the S-T diagram.
- Option (D) correctly represents these features with isothermal lines at constant temperatures and adiabatic processes as curved lines.
Thus, the correct answer is (D).
Was this answer helpful?
0
0
Top GATE PH Physics Questions
- An infinite one-dimensional lattice extends along the x-axis. At each lattice site, there exists an ion with spin 1/2. The spin can point either in the +z or -z direction only. Let \( S_P \), \( S_F \), and \( S_A \) denote the entropies of paramagnetic, ferromagnetic, and antiferromagnetic configurations, respectively. Which of the following relations is/are true?
- Two point charges of charge \( +q \) each are placed a distance \( 2d \) apart. A grounded solid conducting sphere of radius \( a \) is placed midway between them. Assume \( a^2 \ll d^2 \). Which of the following statements is/are true?
- A particle of mass $m$ is moving in the potential
\[ V(x) = \begin{cases} V_0 + \frac{1}{2} m \omega_{0P}^2 x^2 & \quad \text{if } x > 0 \\ \infty & \quad \text{if } x \leq 0 \end{cases} \]
Figures P, Q, R, and S show different combinations of the values of $ \omega_0 $ and $ V_0 $. - Decays of mesons and baryons can be categorized as weak, strong and electromagnetic decays depending upon the interactions involved in the processes. Which of the following option is/are true?
- The temperature \( T \) dependence of magnetic susceptibility \( \chi \) (Column I) of certain magnetic materials (Column II) are given below. Which of the following options is/are correct?
Column I Column II (1) 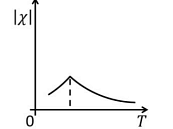
(P) Diamagnetic (2) 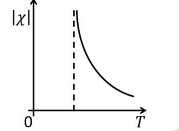
(Q) Paramagnetic (3) 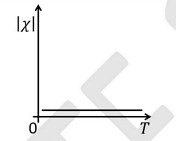
(R) Ferromagnetic (4) 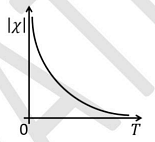
(S) Antiferromagnetic
View More Questions
Top GATE PH Thermodynamics Questions
- The Joule-Thomson expansion of a gas is:
A schematic Pressure-Temperature diagram of water is shown in the figure. Which of the following option(s) is/are correct?

- One mole of an ideal monatomic gas at absolute temperature \( T \) undergoes free expansion to double its original volume, so that the entropy change is \( \Delta S_1 \). An identical amount of the same gas at absolute temperature \( 2T \) undergoes isothermal expansion to double its original volume, so that the entropy change is \( \Delta S_2 \). The value of \( \frac{\Delta S_1}{\Delta S_2} \) (in integer) is:
For a non-magnetic metal, which one of the following graphs best represents the behaviour of \(\frac{C}{T}\) vs. \(T^2\), where \(C\) is the heat capacity and \(T\) is the temperature?

- Which of the following is/are the CORRECT option(s) for the Joule-Thomson effect?
View More Questions
Top GATE PH Questions
- If \( F_1(Q, q) = Qq \) is the generating function of a canonical transformation from \((p, q)\) to \((P, Q)\), then which one of the following relations is correct?
- When an unpolarized plane electromagnetic wave in a dielectric medium with refractive index \( n_1 \) is incident on a plane interface separating it from another dielectric medium with refractive index \( n_2 \) (where \( n_2 > n_1 \)), and the angle of incidence is \(\tan^{-1} \left( \frac{n_2}{n_1} \right) \), the following statement is true:
- The wavefunction of a particle in an infinite one-dimensional potential well at time \( t \) is
\[ \Psi(x, t) = \sqrt{\frac{2}{3}} e^{-iE_1 t/\hbar}\psi_1(x) + \frac{1}{\sqrt{6}} e^{i\pi/6} e^{-iE_2 t/\hbar} \psi_2(x) + \frac{1}{\sqrt{6}} e^{i\pi/4} e^{-iE_3 t/\hbar} \psi_3(x) \]where \(\psi_1\), \(\psi_2\), and \(\psi_3\) are the normalized ground state, the normalized first excited state, and the normalized second excited state, respectively. \(E_1\), \(E_2\), and \(E_3\) are the eigen-energies corresponding to \(\psi_1\), \(\psi_2\), and \(\psi_3\), respectively. The expectation value of energy of the particle in state \(\Psi(x,t)\) is - If a thermodynamical system is adiabatically isolated and experiences a change in volume under an externally applied constant pressure, then the thermodynamical potential minimized at equilibrium is the
- The mean distance between the two atoms of an HD molecule is \( r \), where H and D denote hydrogen and deuterium, respectively. The mass of the hydrogen atom is \( m_H \). The energy difference between the two lowest lying rotational states of HD in multiples of \(\frac{h^2}{m_H r^2}\) is:
View More Questions