The following pie-chart indicates the monthly domestic budget of a family:

where A Food; B = Conveyance; C = Clothing: D = House Rent; E = Miscellaneous Expenses; F = Saving.
If the monthly saving of the family is Rs. 4500, then the monthly income of the family is:
where A Food; B = Conveyance; C = Clothing: D = House Rent; E = Miscellaneous Expenses; F = Saving.
If the monthly saving of the family is Rs. 4500, then the monthly income of the family is:
- Rs. 45000
- Rs. 30000
- Rs. 25000
- Rs. 20000
The Correct Option is B
Solution and Explanation
To find the monthly income of the family, we need to use the information given in the pie chart. The pie chart represents the distribution of the family's monthly budget, including categories like Food, Conveyance, Clothing, House Rent, Miscellaneous Expenses, and Savings. The segment 'F' represents Savings, which is given as Rs. 4500.
From the pie chart, Savings (F) represents 15% of the total monthly income. We can use this percentage to find the total monthly income of the family.
The formula to calculate the total income based on the percentage and amount is:
\(\text{Savings} = \left( \frac{\text{Savings Percentage}}{100} \right) \times \text{Total Income}\)
Substituting the given values:
\(4500 = \left( \frac{15}{100} \right) \times \text{Total Income}\)
Now, solve for Total Income:
\(\text{Total Income} = \frac{4500 \times 100}{15}\)
\(\text{Total Income} = \frac{450000}{15}\)
\(\text{Total Income} = 30000\)
Therefore, the monthly income of the family is Rs. 30000.
Top CMAT Quantitative Ability and Data Interpretation Questions
- If the cost price is 80% of the selling price, then what is the profit in percentage?
- The average age of three friends is 20 years and their ages are in the proportion 2:3:5, the age of the oldest friend is :
- If a 30 meter ladder is placed against a wall such that it just reaches the top of the wall, if the horizontal distance between the wall and the base of the ladder is 1/3rd of the length of ladder, then the height of wall is :
- The following pie chart embodies the details about the per cent production by seven different companies A‐G with the total production for all companies at 1500 units.

(A) Companies A & G are producing more than 500 units
(B) Companies B & F are producing less than 250 units
(C) Companies C & E account for 705 units
(D) Companies D & G are producing less than 200 units
(E) Companies E, F & G account for 545 units
Choose the correct answer from the options given below: - With an average speed of 40 km/hr, a train reaches its destination in time. If it goes with an average speed of 30 km/hr, it is late by 36 minutes. The total distance travelled by train is
Top CMAT Pie Charts Questions
- The following pie chart embodies the details about the per cent production by seven different companies A‐G with the total production for all companies at 1500 units.
(A) Companies A & G are producing more than 500 units
(B) Companies B & F are producing less than 250 units
(C) Companies C & E account for 705 units
(D) Companies D & G are producing less than 200 units
(E) Companies E, F & G account for 545 units
Choose the correct answer from the options given below: - The cost of the three components A, B and C of an electronic machine worth ₹12,000 in 2020 is given as a Pie-chart as shown below :

In the following year, the cost of these three components A, B, and C increased by 10%, 20%, and 10% respectively. The cost of the three components A, B, and C respectively in 2021, was - The total volume of soaps sold is 680 lakhs units. The volume of Lux sold is 136 lakh units. If the
percentage of Lifebuoy sold is 30\(\%\), Camay 10\(\%\), Liril 15\(\%\) and Mysore Sandal 10\(\%\), answer the following
questions.
What is the market share of others in percentage points ? Study the given pie charts carefully to answer the questions that follows

- Study the pie chart and table and answer the questions
Store Respective ratio of number of linen kurtis to cotton kurtis sold A 7:5 B 5:6 C 3:2 D 5:3 E 4:3 F 7:3 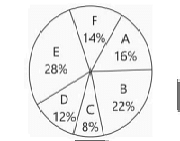
What is the difference between average number of linen kurtis sold by stores D and E together and average number of cotton kurtis sold by the same stores together?
Top CMAT Questions
- If the cost price is 80% of the selling price, then what is the profit in percentage?
- The average age of three friends is 20 years and their ages are in the proportion 2:3:5, the age of the oldest friend is :
- If a 30 meter ladder is placed against a wall such that it just reaches the top of the wall, if the horizontal distance between the wall and the base of the ladder is 1/3rd of the length of ladder, then the height of wall is :
- The following pie chart embodies the details about the per cent production by seven different companies A‐G with the total production for all companies at 1500 units.
(A) Companies A & G are producing more than 500 units
(B) Companies B & F are producing less than 250 units
(C) Companies C & E account for 705 units
(D) Companies D & G are producing less than 200 units
(E) Companies E, F & G account for 545 units
Choose the correct answer from the options given below: - With an average speed of 40 km/hr, a train reaches its destination in time. If it goes with an average speed of 30 km/hr, it is late by 36 minutes. The total distance travelled by train is