The bar chart shows the revenue (in lakhs) of a company from three products-X, Y, and Z-over four years (2010 - 2013). In which year is the total revenue highest?

The bar chart shows the revenue (in lakhs) of a company from three products-X, Y, and Z-over four years (2010 - 2013). In which year is the total revenue highest?
Show Hint
- 2010
- 2011
- 2012
- 2013
\bigskip
The Correct Option is C
Solution and Explanation
| Year | Product X | Product Y | Product Z | Total Revenue |
|---|---|---|---|---|
| 2010 | 50 | 40 | 30 | 120 |
| 2011 | 60 | 50 | 40 | 150 |
| 2012 | 70 | 60 | 50 | 180 |
| 2013 | 80 | 55 | 45 | 180 |
- 2010: 50 + 40 + 30 = 120 lakhs
- 2011: 60 + 50 + 40 = 150 lakhs
- 2012: 70 + 60 + 50 = 180 lakhs
- 2013: 80 + 55 + 45 = 180 lakhs
Top CAT Data Interpretation & Logical Reasoning (DILR) Questions
- The local office of the APP-CAB company evaluates the performance of five cab drivers, Arun, Barun, Chandan, Damodaran, and Eman for their monthly payment based on ratings in five different parameters (P1 to P5) as given below:
P1: timely arrival
P2: behaviour
P3: comfortable ride
P4: driver's familiarity with the route
P5: value for money
Based on feedback from the customers, the office assigns a rating from 1 to 5 in each of these parameters. Each rating is an integer from a low value of 1 to a high value of 5. The final rating of a driver is the average of his ratings in these five parameters. The monthly payment of the drivers has two parts – a fixed payment and final rating-based bonus. If a driver gets a rating of 1 in any of the parameters, he is not eligible to get bonus. To be eligible for bonus a driver also needs to get a rating of five in at least one of the parameters. The partial information related to the ratings of the drivers in different parameters and the monthly payment structure (in rupees) is given in the table below:The following additional facts are known.P1 P2 P3 P4 P5 Fixed Payment Bonus Arun 4 Rs. 1000 Rs. 250 × Final Rating Barun 3 Rs. 1200 Rs. 200 × Final Rating Chandan 2 Rs. 1400 Rs. 100 × Final Rating Damodaran 3 Rs. 1300 Rs. 150 × Final Rating Eman 2 Rs. 1100 Rs. 200 × Final Rating
Arun and Barun have got a rating of 5 in exactly one of the parameters. Chandan has got a rating of 5 in exactly two parameters.
None of drivers has got the same rating in three parameters. - Ten musicians (A, B, C, D, E, F, G, H, I and J) are experts in at least one of the following three percussion instruments: tabla, mridangam, and ghatam. Among them, three are experts in tabla but not in mridangam or ghatam, another three are experts in mridangam but not in tabla or ghatam, and one is an expert in ghatam but not in tabla or mridangam. Further, two are experts in tabla and mridangam but not in ghatam, and one is an expert in tabla and ghatam but not in mridangam.
The following facts are known about these ten musicians.
1. Both A and B are experts in mridangam, but only one of them is also an expert in tabla.
2. D is an expert in both tabla and ghatam.
3. Both F and G are experts in tabla, but only one of them is also an expert in mridangam.
4. Neither I nor J is an expert in tabla.
5. Neither H nor I is an expert in mridangam, but only one of them is an expert in ghatam. - Four institutes, A, B, C, and D, had contracts with four vendors W, X, Y, and Z during the ten calendar years from 2010 to 2019. The contracts were either multi-year contracts running for several consecutive years or single-year contracts. No institute had more than one contract with the same vendor. However, in a calendar year, an institute may have had contracts with multiple vendors, and a vendor may have had contracts with multiple institutes. It is known that over the decade, the institutes each got into two contracts with two of these vendors, and each vendor got into two contracts with two of these institutes.
The following facts are also known about these contracts.
I. Vendor Z had at least one contract in every year.
II. Vendor X had one or more contracts in every year up to 2015, but no contract in any year after that.
III. Vendor Y had contracts in 2010 and 2019. Vendor W had contracts only in 2012.
IV. There were five contracts in 2012.
V. There were exactly four multi-year contracts. Institute B had a 7-year contract, D had a 4- year contract, and A and C had one 3-year contract each. The other four contracts were single-year contracts.
VI. Institute C had one or more contracts in 2012 but did not have any contract in 2011.
VII. Institutes B and D each had exactly one contract in 2012. Institute D did not have any contract in 2010. - In a certain board examination, students were to appear for examination in five subjects: English, Hindi, Mathematics, Science and Social Science. Due to a certain emergency situation, a few of the examinations could not be conducted for some students. Hence, some students missed one examination and some others missed two examinations. Nobody missed more than two examinations.
The board adopted the following policy for awarding marks to students. If a student appeared in all five examinations, then the marks awarded in each of the examinations were on the basis of the scores obtained by them in those examinations.
If a student missed only one examination, then the marks awarded in that examination was the average of the best three among the four scores in the examinations they appeared for.
If a student missed two examinations, then the marks awarded in each of these examinations was the average of the best two among the three scores in the examinations they appeared for.
The marks obtained by six students in the examination are given in the table below. Each of them missed either one or two examinations.English Hindi Mathematics Science Social Science Alva 80 75 70 75 60 Bithi 90 80 55 85 85 Carl 75 80 90 100 90 Deep 70 90 100 90 80 Esha 80 85 95 60 55 Foni 83 72 78 88 83
The following facts are also known.
I. Four of these students appeared in each of the English, Hindi, Science, and Social Science examinations. II. The student who missed the Mathematics examination did not miss any other examination.
III. One of the students who missed the Hindi examination did not miss any other examination. The other student who missed the Hindi examination also missed the Science examination. - 1000 patients currently suffering from a disease were selected to study the effectiveness of treatment of four types of medicines — A, B, C and D. These patients were first randomly assigned into two groups of equal size, called treatment group and control group. The patients in the control group were not treated with any of these medicines; instead they were given a dummy medicine, called placebo, containing only sugar and starch. The following information is known about the patients in the treatment group.
a. A total of 250 patients were treated with type A medicine and a total of 210 patients were treated with type C medicine.
b. 25 patients were treated with type A medicine only. 20 patients were treated with type C medicine only. 10 patients were treated with type D medicine only.
c. 35 patients were treated with type A and type D medicines only. 20 patients were treated with type A and type B medicines only. 30 patients were treated with type A and type C medicines only. 20 patients were treated with type C and type D medicines only.
d. 100 patients were treated with exactly three types of medicines.
e. 40 patients were treated with medicines of types A, B and C, but not with medicines of type D. 20 patients were treated with medicines of types A, C and D, but not with medicines of type B.
f. 50 patients were given all the four types of medicines. 75 patients were treated with exactly one type of medicine.
Top CAT Data Interpretation Questions
- Amudha, Bharatan, Chandran, Dhinesh, Ezhil, Fani and Gowtham are seven people in a town. Any pair of them could either be strangers, acquaintances, or friends. All relationships are mutual. For example, if Amudha is a friend of Bharatan, then Bharatan is also a friend of Amudha. Similarly, if Amudha is a stranger to Bharatan, then Bharatan is also a stranger to Amudha.
Partial information about the number of friends, acquaintances, and strangers of each of these people among them is given in the table below.No. of Friends No. of Acquaintances No. of Strangers Amudha 1 4 Bharatan Chandran 1 Dhinesh 2 Ezhil 1 Fani 1 Gowtham 3 2 The following additional facts are also known.
1. Amudha, Bharatan, and Chandran are mutual strangers.
2. Amudha, Dhinesh, and Fani are Ezil's friends.
3. Chandran and Gowtham are friends.
4. Every friend of Amudha is an acquaintance of Bharatan, and every acquaintance of Bharatan is a friend of Amudha.
5. Every friend of Bharatan is an acquaintance of Amudha, and every acquaintance of Amudha is a friend of Bharatan. - Ganga, Kaveri, and Narmada are three women who buy four raw materials (Mango, Apple, Banana and Milk) and sell five finished products (Mango smoothie, Apple smoothie, Banana smoothie, Mixed fruit smoothie and Fruit salad). Table-1 gives information about the raw materials required to produce the five finished products. One unit of a finished product requires one unit of each of the raw materials mentioned in the second column of the table.
Finished product Raw materials required mango smoothie Mango, Milk Apple smoothie Apple, Milk Banana smoothie Banana, Milk Mixed fruit smoothie Mango, Apple, Banana, Milk Fruit salad Mango, Apple, Banana One unit of milk, mango, apple, and banana cost ₹5, ₹3, ₹2, and ₹1 respectively. Each unit of a finished product is sold for a profit equal to two times the number of raw materials used to make that product. For example, apple smoothie is made with two raw materials (apple and milk) and will be sold for a profit of ₹4 per unit. Leftover raw materials are sold during the last business hour of the day for a loss of ₹1 per unit.
The amount, in rupees, received from sales (revenue) for each woman in each of the four business hours of the day is given in Table-2.Business Hour Ganga Kaveri Narmada Hour 1 23 19 31 Hour 2 21 22 21 Hour 3 29 30 23 Hour 4 (last hour) 30 27 22 The following additional facts are known.
1. No one except possibly Ganga sold any Mango smoothie.
2. Each woman sold either zero or one unit of any single finished product in any hour.
3. Each woman had exactly one unit each of two different raw materials as leftovers.
4. No one had any banana leftover.. - Ten objects o1, o2, …, o10 were distributed among Amar, Barat, Charles, Disha, and Elise. Each item went to exactly one person. Each person got exactly two of the items, and this pair of objects is called her/his bundle.
The following table shows how each person values each object.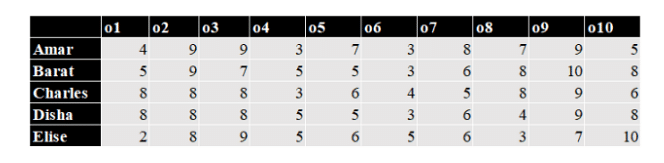
The value of any bundle by a person is the sum of that person’s values of the objects in that bundle. A person X envies another person Y if X values Y’s bundle more than X’s own bundle.
For example, hypothetically suppose Amar’s bundle consists of o1 and o2, and Barat’s bundle consists of o3 and o4. Then Amar values his own bundle at 4 + 9 = 13 and Barat’s bundle at 9 + 3 = 12. Hence Amar does not envy Barat. On the other hand, Barat values his own bundle at 7 + 5 = 12 and Amar’s bundle at 5 + 9 = 14. Hence Barat envies Amar.
The following facts are known about the actual distribution of the objects among the five people.
1. If someone’s value for an object is 10, then she/he received that object.
2. Objects o1, o2, and o3 were given to three different people.
3. Objects o1 and o8 were given to different people.
4. Three people value their own bundles at 16. No one values her/his own bundle at a number higher than 16.
5. Disha values her own bundle at an odd number. All others value their own bundles at an even number.
6. Some people who value their own bundles less than 16 envy some other people who value their own bundle at 16. No one else envies others. - Ravi works in an online food-delivery company. After each delivery, customers rate Ravi on each of four parameters - Behaviour, Packaging, Hygiene, and Timeliness, on a scale from 1 to 9. If the total of the four rating points is 25 or more, then Ravi gets a bonus of ₹20 for that delivery. Additionally, a customer may or may not give Ravi a tip. If the customer gives a tip, it is either ₹30 or ₹50. One day, Ravi made four deliveries - one to each of Atal, Bihari, Chirag, and Deepak, and received a total of ₹120 in bonus and tips. He did not get both a bonus and a tip from the same customer.
The following additional facts are also known.
1. In Timeliness, Ravi received a total of 21 points, and three of the customers gave him the same rating points in this parameter. Atal gave higher rating points than Bihari and Chirag in this parameter.
2. Ravi received distinct rating points in Packaging from the four customers adding up to 29 points. Similarly, Ravi received distinct rating points in Hygiene from the four customers adding up to 26 points.
3. Chirag gave the same rating points for Packaging and Hygiene.
4. Among the four customers, Bihari gave the highest rating points in Packaging, and Chirag gave the highest rating points in Hygiene.
5. Everyone rated Ravi between 5 and 7 in Behaviour. Unique maximum and minimum ratings in this parameter were given by Atal and Deepak respectively.
6. If the customers are ranked based on ratings given by them in individual parameters, then Atal’s rank based on Packaging is the same as that based on Hygiene. This is also true for Deepak. - Three reviewers Amal, Bimal, and Komal are tasked with selecting questions from a pool of 13 questions (Q01 to Q13). Questions can be created by external “subject matter experts” (SMEs) or by one of the three reviewers. Each of the reviewers either approves or disapproves a question that is shown to them. Their decisions lead to eventual acceptance or rejection of the question in the manner described below.
If a question is created by an SME, it is reviewed first by Amal, and then by Bimal. If both of them approve the question, then the question is accepted and is not reviewed by Komal. If both disapprove the question, it is rejected and is not reviewed by Komal. If one of them approves the question and the other disapproves it, then the question is reviewed by Komal. Then the question is accepted only if she approves it.
A question created by one of the reviewers is decided upon by the other two. If a question is created by Amal, then it is first reviewed by Bimal. If Bimal approves the question, then itis accepted. Otherwise, it is reviewed by Komal. The question is then accepted only if Komal approves it. A similar process is followed for questions created by Bimal, whose questions are first reviewed by Komal, and then by Amal only if Komal disapproves it. Questions created by Komal are first reviewed by Amal, and then, if required, by Bimal.
The following facts are known about the review process after its completion.
1. Q02, Q06, Q09, Q11, and Q12 were rejected and the other questions were accepted.
2. Amal reviewed only Q02, Q03, Q04, Q06, Q08, Q10, Q11, and Q13.
3. Bimal reviewed only Q02, Q04, Q06 through Q09, Q12, and Q13.
4. Komal reviewed only Q01 through Q05, Q07, Q08, Q09, Q11, and Q12.
Top CAT Questions
- Compare and contrast between Portia and Jessica characters in Merchant of Venice.
- In a triangle ABC,AB=AC=8cm. A circle drawn with BC as diameter passes through A. Another circle drawn with center at A passes through B and C. Then the area,in sq.cm,of the overlapping region between the two circles is
- The simple interest accrued on an amount of Rs.25,000 at the end of three years is Rs.7,500. What would be the compound interest accrued on the same amount at the same rate in the same period?
- What is the sum of all roots of the equation \(|x+4|^2–10|x+4|=24\)?
- A solid metal sphere is melted and smaller spheres of equal radii are formed. 10% of the volume of the sphere is lost in the process. The smaller spheres have a radius which is \(\frac{1}{9}\text{th}\) the larger sphere. If 10 litres of paint were needed to paint the larger sphere,how many litres are needed to paint all the smaller spheres?