A polymerase chain reaction (PCR) based diagnosis test was performed on a bacterial sample targeting a specific gene. There are 3 copies of this gene in the bacterial genome. Prior to DNA extraction, the bacteria were incubated to allow one cycle of growth. 3072 amplicon copies were obtained after 9 cycles of the PCR. Assume 100% efficiency at each step. The initial bacterial count in the sample was ....... (Answer in integer)
Show Hint
Solution and Explanation
Top GATE XL Microbiology Questions
- Which one or more of the following statements is/are correct regarding the electromotive force generated by electron transfer chain?
- Which of the following plant natural products is/are cyanogenic glycoside(s)?
- Which of the following selectable marker genes is/are used for herbicide tolerance during genetic transformation of plants?
- Which one or more of the following statements is/are correct regarding the electromotive force generated by electron transfer chain?
- Which of the following plant natural products is/are cyanogenic glycoside(s)?
Top GATE XL Bacterial cell Questions
- Which one of the following metabolites is associated with bacterial stringent response?
Correctly match the bacterial type in Column I with their corresponding environmental niche in Column II:

A penicillin sensitive Escherichia coli population is exposed to a lethal dose (200 µg/ml) of penicillin. Assuming density-independent mortality, which one of the following relationships would describe the number of surviving bacteria (N) over time (T)?
The adaptive immune response in an animal involves the generation of antibodies against an invading bacterial pathogen. The following graph represents antibody titer levels in a mammal exposed twice to the pathogen.
Which one of the following options correctly pairs antibodies to peak I and peak II in the graph?
Which option(s) correctly match(es) the structures in a bacterial cell (Column I) with their corresponding functions (Column II)?

Top GATE XL Questions
- The CORRECT order of electronegativity is
- Which one of the following is the CORRECT representation of the variation of the Gibbs free energy (G) of a substance with temperature (T) at constant pressure?
- Among the following, the structure representing histidine is
- The CORRECT order of acidity of the following compounds is
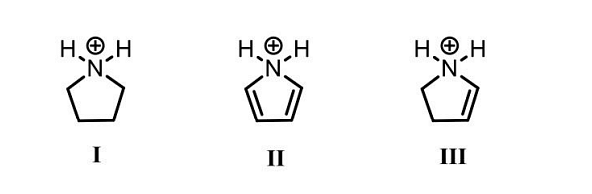
- The molecules A and B are a pair of___