Question:
Which one of the given figures P, Q, R, and S represents the graph of the following function? \[ f(x) = |x + 2| - |x - 1| \] 
Which one of the given figures P, Q, R, and S represents the graph of the following function? \[ f(x) = |x + 2| - |x - 1| \]
Show Hint
- Absolute value functions break into piecewise linear sections, which can cause slope changes at certain points (where the inside expression equals zero).
- To graph such functions, first identify these critical points and then plot accordingly in each region.
Updated On: Sep 3, 2025
- P
- Q
- R
- S
Show Solution
Verified By Collegedunia
The Correct Option is A
Solution and Explanation
We are given the function:
\[
f(x) = |x + 2| - |x - 1|
\]
To determine the graph of this function, we need to analyze the behavior of each part of the function.
1) Function Analysis:
We can break the function into two absolute value terms. The behavior of the function will change depending on whether \( x \) is less than -2, between -2 and 1, or greater than 1. We need to analyze these intervals to plot the graph.
- For \( x<-2 \), both \( x + 2 \) and \( x - 1 \) are negative, so the graph will have a linear decrease.
- For \( -2 \leq x \leq 1 \), \( x + 2 \) is positive, and \( x - 1 \) is negative, resulting in a change in slope and a turning point.
- For \( x>1 \), both terms are positive, resulting in a different slope.
2) Matching the Graph:
Upon examining the graphs, the graph labeled \( P \) fits the expected behavior of the function with changes in slope at \( x = -2 \) and \( x = 1 \). Thus, the correct graph is option (A).
\[ \boxed{\text{The correct answer is (A) P.}} \]
Was this answer helpful?
0
0
Top GATE XL Life Science Questions
- Which one of the following molecules captures \(CO_2\) in the \(CO_4\) cycle?
- Which one of the following methods separates biomolecules based on their hydrodynamic volumes?
- Which one of the following restriction endonucleases is a blunt cutter?
- Which one of the following ion channels opens to repolarize the neuronal membrane when an action potential is generated?
- Which one of the following is the most sensitive immunoassay?
View More Questions
Top GATE XL Life Science Questions
An opaque cylinder (shown below) is suspended in the path of a parallel beam of light, such that its shadow is cast on a screen oriented perpendicular to the direction of the light beam. The cylinder can be reoriented in any direction within the light beam. Under these conditions, which one of the shadows P, Q, R, and S is NOT possible?

- Which one among the following mixtures gives a buffer solution in water?
What is the major product formed in the given reaction?

- The CORRECT order of stability of the given metal oxides is
Suitable reagent(s) to bring about the conversion of P to Q in good yield is/are

View More Questions
Top GATE XL Questions
- The CORRECT order of electronegativity is
- Which one of the following is the CORRECT representation of the variation of the Gibbs free energy (G) of a substance with temperature (T) at constant pressure?
- Among the following, the structure representing histidine is
- The CORRECT order of acidity of the following compounds is
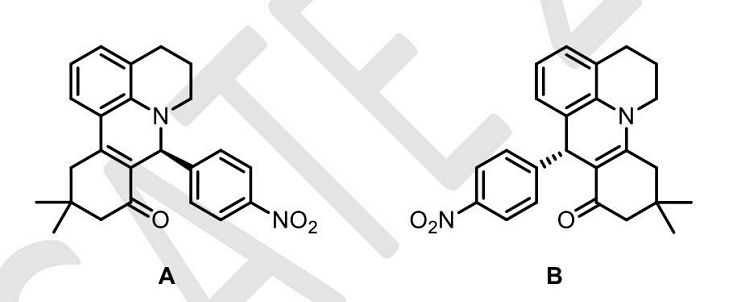
- The molecules A and B are a pair of___
View More Questions