Question:
Consider the Otto cycle for an ideal gas engine consisting of two quasistatic adiabatic and two quasistatic isochoric processes. The correct temperature-entropy (T-S) phase diagram for the cycle is:
Consider the Otto cycle for an ideal gas engine consisting of two quasistatic adiabatic and two quasistatic isochoric processes. The correct temperature-entropy (T-S) phase diagram for the cycle is:
Show Hint
An adiabatic (isentropic) step is a vertical line on a T-S plot.
An isochoric step is a curved, convex line, not straight, since \(S=C_V\ln T + R\ln V+\text{const}\).
The isochore at the smaller (compressed) volume sits above the one at the larger volume.
An isochoric step is a curved, convex line, not straight, since \(S=C_V\ln T + R\ln V+\text{const}\).
The isochore at the smaller (compressed) volume sits above the one at the larger volume.
Updated On: Aug 17, 2026


Show Solution

Verified By Collegedunia
The Correct Option is A
Solution and Explanation
Step 1: Recall what each part of the Otto cycle does.
The Otto cycle has four quasistatic steps: 1 to 2 is an adiabatic (isentropic) compression, 2 to 3 is an isochoric (constant volume) heat addition, 3 to 4 is an adiabatic (isentropic) expansion, and 4 to 1 is an isochoric heat rejection back to the starting state. We need to know what each of these two process types looks like on a temperature versus entropy (T-S) plot.
Step 2: Key Formula or Approach:
For an ideal gas the entropy of one mole can be written as \(S = C_V \ln T + R \ln V + \text{const}\). Along a quasistatic adiabatic process the process is isentropic by definition, so \(dS = 0\): on a T-S plot this is a straight VERTICAL line, since T can change while S stays fixed. Along an isochoric process V is fixed but T changes, so from \(S = C_V \ln T + \text{const}(V)\), which rearranges to \(T = A(V)\, e^{S/C_V}\), this is an increasing, upward-curving (convex) exponential-shaped line, never a straight line.
Step 3: Work out where the two isochores sit relative to each other.
The 2-3 heat addition happens at the smaller, compressed volume \(V_2\), and the 4-1 heat rejection happens at the larger volume \(V_1 \gt V_2\). Since \(S = C_V\ln T + R\ln V + \text{const}\), for the same entropy value a larger volume needs a smaller temperature to keep S the same (the \(R\ln V\) term is larger, so \(C_V\ln T\) must be smaller). So the isochore belonging to the smaller volume \(V_2\) sits above (higher T for the same S) the isochore belonging to the larger volume \(V_1\).
Step 4: Match this to the four panels.
We need a shape with two vertical segments (the adiabats) and two convex upward-curving segments (the isochores), where the upper curve is the 2-3 heat addition and the lower curve is the 4-1 heat rejection, walked in the order 1 (bottom-left) up to 2, across the upper curve to 3, down to 4, and back across the lower curve to 1. This is exactly panel (A).
Step 5: Why the others fail.
Panel (B) draws the identical curve shape but swaps the positions of states 2 and 4, so walking 1 to 2 to 3 to 4 to 1 in that panel traces compression and heat addition in the wrong place relative to the curved isochores, it does not match the Otto sequence. Panels (C) and (D) draw the isochores as straight horizontal sides of a rectangle. A straight horizontal line on a T-S plot means T stays constant while S changes, that is an isothermal process, not an isochoric one, so both misrepresent the physics of the isochoric legs.
Final Answer:
Only panel (A) shows two vertical adiabats joined by two correctly-ordered convex isochores. \[ \boxed{\text{Option (A)}} \]
The Otto cycle has four quasistatic steps: 1 to 2 is an adiabatic (isentropic) compression, 2 to 3 is an isochoric (constant volume) heat addition, 3 to 4 is an adiabatic (isentropic) expansion, and 4 to 1 is an isochoric heat rejection back to the starting state. We need to know what each of these two process types looks like on a temperature versus entropy (T-S) plot.
Step 2: Key Formula or Approach:
For an ideal gas the entropy of one mole can be written as \(S = C_V \ln T + R \ln V + \text{const}\). Along a quasistatic adiabatic process the process is isentropic by definition, so \(dS = 0\): on a T-S plot this is a straight VERTICAL line, since T can change while S stays fixed. Along an isochoric process V is fixed but T changes, so from \(S = C_V \ln T + \text{const}(V)\), which rearranges to \(T = A(V)\, e^{S/C_V}\), this is an increasing, upward-curving (convex) exponential-shaped line, never a straight line.
Step 3: Work out where the two isochores sit relative to each other.
The 2-3 heat addition happens at the smaller, compressed volume \(V_2\), and the 4-1 heat rejection happens at the larger volume \(V_1 \gt V_2\). Since \(S = C_V\ln T + R\ln V + \text{const}\), for the same entropy value a larger volume needs a smaller temperature to keep S the same (the \(R\ln V\) term is larger, so \(C_V\ln T\) must be smaller). So the isochore belonging to the smaller volume \(V_2\) sits above (higher T for the same S) the isochore belonging to the larger volume \(V_1\).
Step 4: Match this to the four panels.
We need a shape with two vertical segments (the adiabats) and two convex upward-curving segments (the isochores), where the upper curve is the 2-3 heat addition and the lower curve is the 4-1 heat rejection, walked in the order 1 (bottom-left) up to 2, across the upper curve to 3, down to 4, and back across the lower curve to 1. This is exactly panel (A).
Step 5: Why the others fail.
Panel (B) draws the identical curve shape but swaps the positions of states 2 and 4, so walking 1 to 2 to 3 to 4 to 1 in that panel traces compression and heat addition in the wrong place relative to the curved isochores, it does not match the Otto sequence. Panels (C) and (D) draw the isochores as straight horizontal sides of a rectangle. A straight horizontal line on a T-S plot means T stays constant while S changes, that is an isothermal process, not an isochoric one, so both misrepresent the physics of the isochoric legs.
Final Answer:
Only panel (A) shows two vertical adiabats joined by two correctly-ordered convex isochores. \[ \boxed{\text{Option (A)}} \]
Was this answer helpful?
0
0
Top GATE PH Physics Questions
- An infinite one-dimensional lattice extends along the x-axis. At each lattice site, there exists an ion with spin 1/2. The spin can point either in the +z or -z direction only. Let \( S_P \), \( S_F \), and \( S_A \) denote the entropies of paramagnetic, ferromagnetic, and antiferromagnetic configurations, respectively. Which of the following relations is/are true?
- Two point charges of charge \( +q \) each are placed a distance \( 2d \) apart. A grounded solid conducting sphere of radius \( a \) is placed midway between them. Assume \( a^2 \ll d^2 \). Which of the following statements is/are true?
- A particle of mass $m$ is moving in the potential
\[ V(x) = \begin{cases} V_0 + \frac{1}{2} m \omega_{0P}^2 x^2 & \quad \text{if } x > 0 \\ \infty & \quad \text{if } x \leq 0 \end{cases} \]
Figures P, Q, R, and S show different combinations of the values of $ \omega_0 $ and $ V_0 $. - Decays of mesons and baryons can be categorized as weak, strong and electromagnetic decays depending upon the interactions involved in the processes. Which of the following option is/are true?
- The temperature \( T \) dependence of magnetic susceptibility \( \chi \) (Column I) of certain magnetic materials (Column II) are given below. Which of the following options is/are correct?
Column I Column II (1) 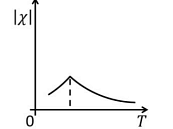
(P) Diamagnetic (2) 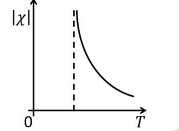
(Q) Paramagnetic (3) 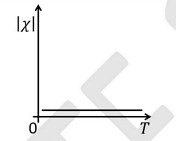
(R) Ferromagnetic (4) 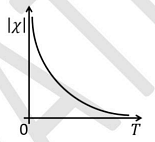
(S) Antiferromagnetic
View More Questions
Top GATE PH Thermodynamic and Statistical Physics Questions
- For a finite system of Fermions where the density of states increases with energy, the chemical potential
- Consider a system of three distinguishable particles, each having spin \( S = \frac{1}{2} \) such that \( S_z = \pm \frac{1}{2} \) with corresponding magnetic moments \( \mu_z = \pm \mu \). When the system is placed in an external magnetic field \( H \) pointing along the z-axis, the total energy of the system is \( \mu H \). Let \( x \) be the state where the first spin has \( S_z = \frac{1}{2} \). The probability of having the state \( x \) and the mean magnetic moment (in the +z direction) of the system in state \( x \) are
Consider a single one-dimensional harmonic oscillator of angular frequency \( \omega \), in equilibrium at temperature \( T = \left( k_B \beta \right)^{-1 }\). The states of the harmonic oscillator are all non-degenerate having energy \( E_n = \left( n + \frac{1}{2} \right) \hbar \omega \) with equal probability, where \( n \) is the quantum number. The Helmholtz free energy of the oscillator is
A system of two atoms can be in three quantum states having energies 0, $\epsilon$ and $2\epsilon$. The system is in equilibrium at temperature \( T = (k_B\beta)^{-1} \). Match the following Statistics with the Partition function.

- The formula for energy \(E\) of a photon gas at temperature \(T\) in a two-dimensional box at equilibrium with \(g_{2d}(\nu)\) denoting the density of states of photons is given below, where symbols \(\nu\), \(h\) and \(k_B\) have their standard meaning. The specific heat (\(C_V\)) of this photon gas obeys
\[ E = \int_0^{\infty} d\nu \, g_{2d}(\nu) \, \frac{h\nu}{\exp\left(\dfrac{h\nu}{k_B T}\right) - 1} \]
View More Questions
Top GATE PH Questions
- If \( F_1(Q, q) = Qq \) is the generating function of a canonical transformation from \((p, q)\) to \((P, Q)\), then which one of the following relations is correct?
- When an unpolarized plane electromagnetic wave in a dielectric medium with refractive index \( n_1 \) is incident on a plane interface separating it from another dielectric medium with refractive index \( n_2 \) (where \( n_2 > n_1 \)), and the angle of incidence is \(\tan^{-1} \left( \frac{n_2}{n_1} \right) \), the following statement is true:
- The wavefunction of a particle in an infinite one-dimensional potential well at time \( t \) is
\[ \Psi(x, t) = \sqrt{\frac{2}{3}} e^{-iE_1 t/\hbar}\psi_1(x) + \frac{1}{\sqrt{6}} e^{i\pi/6} e^{-iE_2 t/\hbar} \psi_2(x) + \frac{1}{\sqrt{6}} e^{i\pi/4} e^{-iE_3 t/\hbar} \psi_3(x) \]where \(\psi_1\), \(\psi_2\), and \(\psi_3\) are the normalized ground state, the normalized first excited state, and the normalized second excited state, respectively. \(E_1\), \(E_2\), and \(E_3\) are the eigen-energies corresponding to \(\psi_1\), \(\psi_2\), and \(\psi_3\), respectively. The expectation value of energy of the particle in state \(\Psi(x,t)\) is - If a thermodynamical system is adiabatically isolated and experiences a change in volume under an externally applied constant pressure, then the thermodynamical potential minimized at equilibrium is the
- The mean distance between the two atoms of an HD molecule is \( r \), where H and D denote hydrogen and deuterium, respectively. The mass of the hydrogen atom is \( m_H \). The energy difference between the two lowest lying rotational states of HD in multiples of \(\frac{h^2}{m_H r^2}\) is:
View More Questions